
Cloud-Bricks uses data screens (dashboards) to show the
current usage of various types of resources.
They will help you to manage your virtual and physical
infrastructure, and to control resource allocation.
Dashboard: Resource usage
This dashboard is on the left menu on "Statistics>Dashboard".
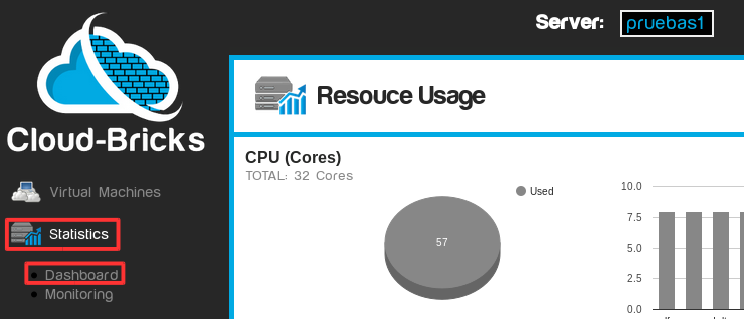
It provides information related to CPU and RAM usage.
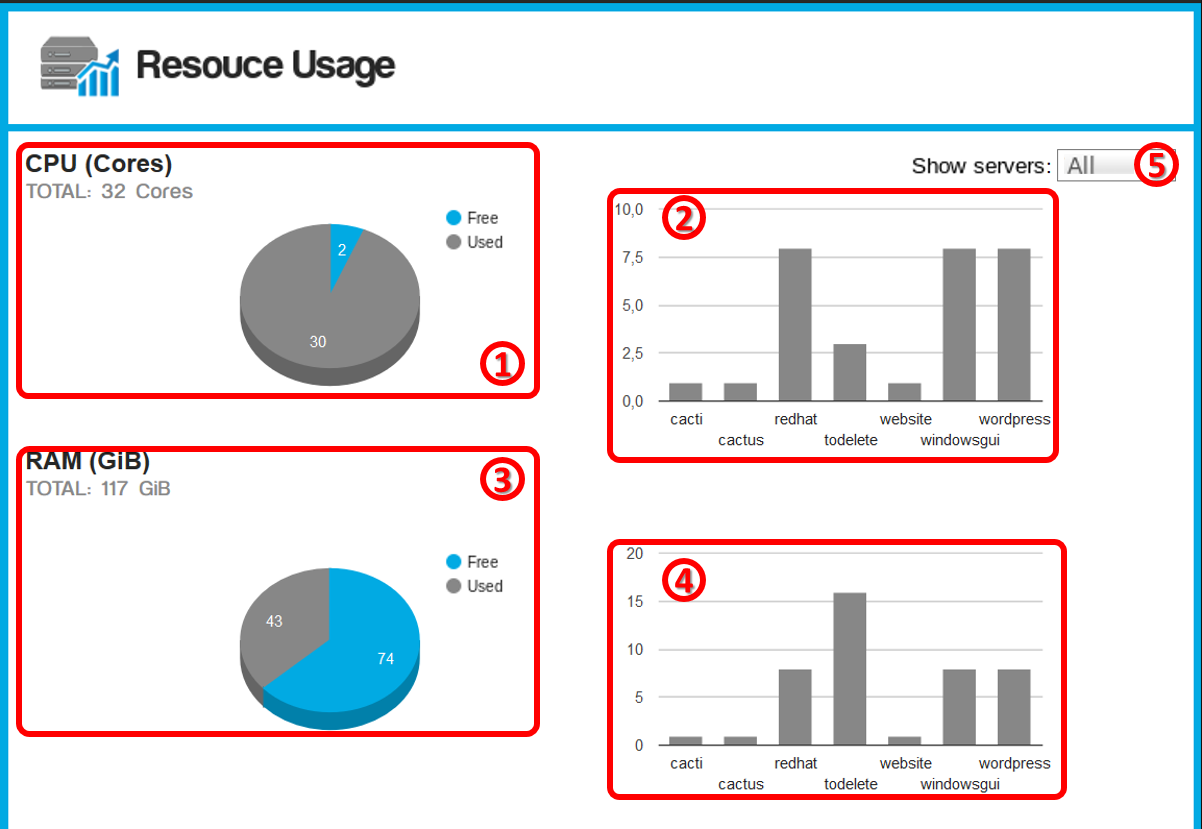
- Chart total usage of processors. Shows number of physical CPUs available, specifying used and free CPU cores.
- Chart of vCPUs allocated per virtual machine.
- Chart of physical memory usage. Illustrates the allocated and free RAM.
- Chart of RAM allocated for each virtual machine.
- Filter the data to show information about all virtual machines or just those that are currently on.
Dashboard: Backup system
This dashboard may be found on the left menu navigating to "Storage>Backup system".
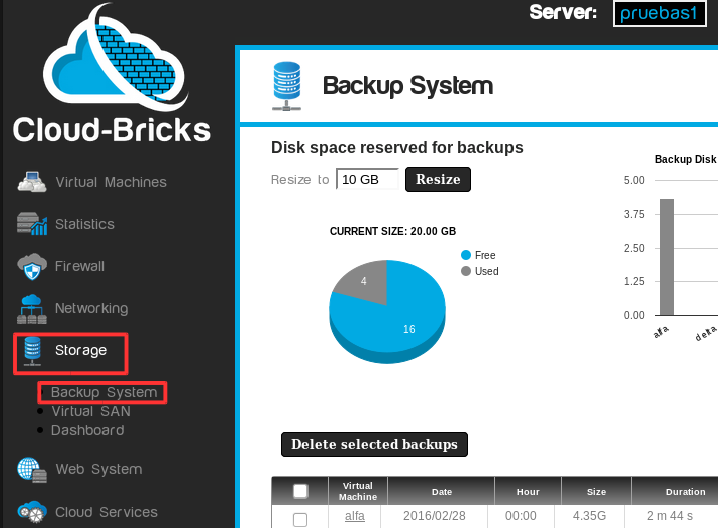
It provides information related to backup space and related disk usage.
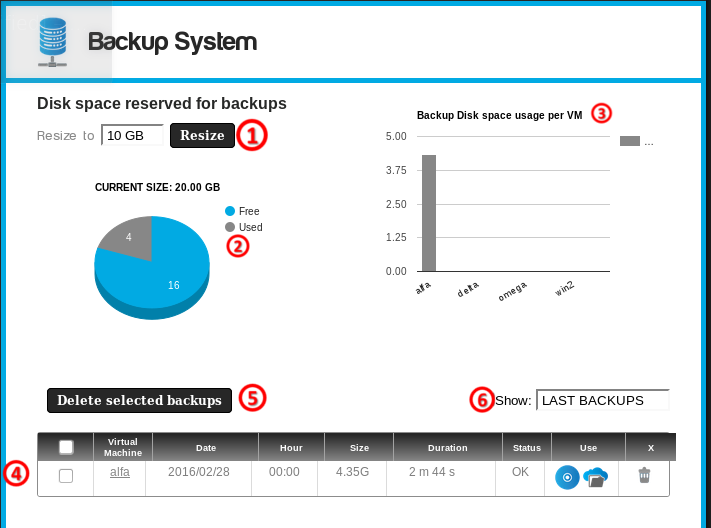
- Resize: Option to increase or decrease the reserved storage space dedicated to backups.
- Backups space usage, shows free and used space.
- Chart of backup space usage per virtual machine.
- List of available backups. Here you can download a backup in .ISO format or mount it as a virtual CD-ROM on a Virtual Server in order to access the backup files.
- Delete selected backups button: Remove backups selected within the list. This task cannot be undone!.
- Backups filter: Allows you to filter the list of backups by virtual machine or by date.
Dashboard: Disk space
This dashboard is located on the left menu navigating to "Storage>Dashboard".
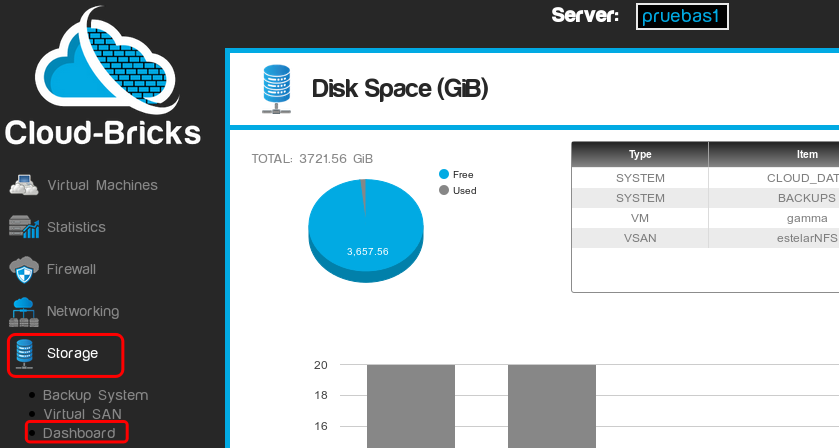
Here you can monitor how your disk space is being used.
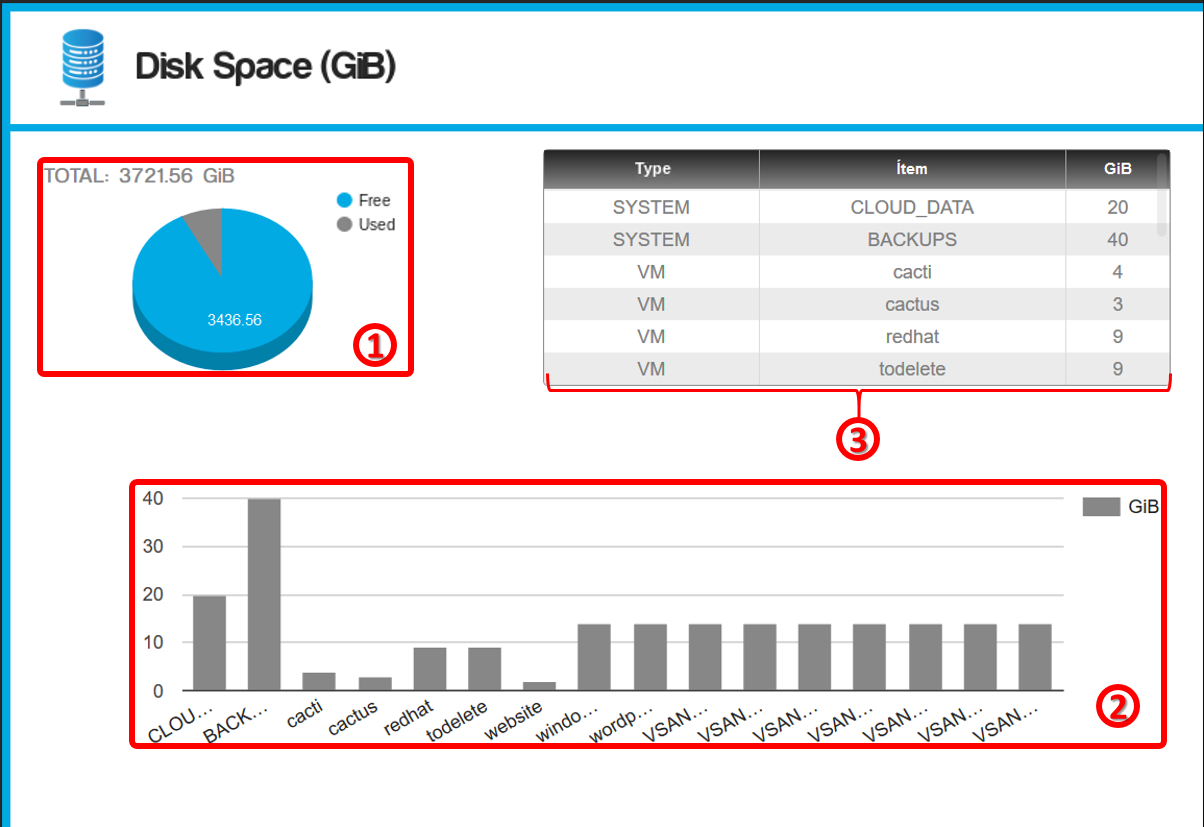
- Chart of physical storage usage.
In order to calculate used disk space, the system takes in count the space used by virtual machines, the space used for virtual SANs, space reserved for backups and reserved system space (CLOUD_DATA).
- Chart of the space used by each item.
- Table illustrating the space used by the virtual machine, vSANs, backups and system reserved file systems.